
We previously introduced what Q-DAS is and its importance in manufacturing process management and data analysis in our blog.
Yes~. Last time, we learned what Q-DAS is and that it helps our manufacturing industry go digital.
Today, we’ll be talking about how to achieve seamless quality control and fast problem-solving from the shop floor to data analysis—and we’ll give you a closer look at the licenses (O-QIS, QS-STAT and Q-DM) and features that can help.
- O-QIS: Enables real-time quality data collection and easy operation for quick decision-making on the shop floor.
- QS-STAT: Enables detailed statistical analysis to identify trends, variations, and issues in your production process.
- Q-DM: Enables centralized management of production data with tools to support quality improvement.
Each license has its own role and features, so choosing the right ones helps address our current challenges.
Let’s take a look at the key features of each one and figure out what works best for you.
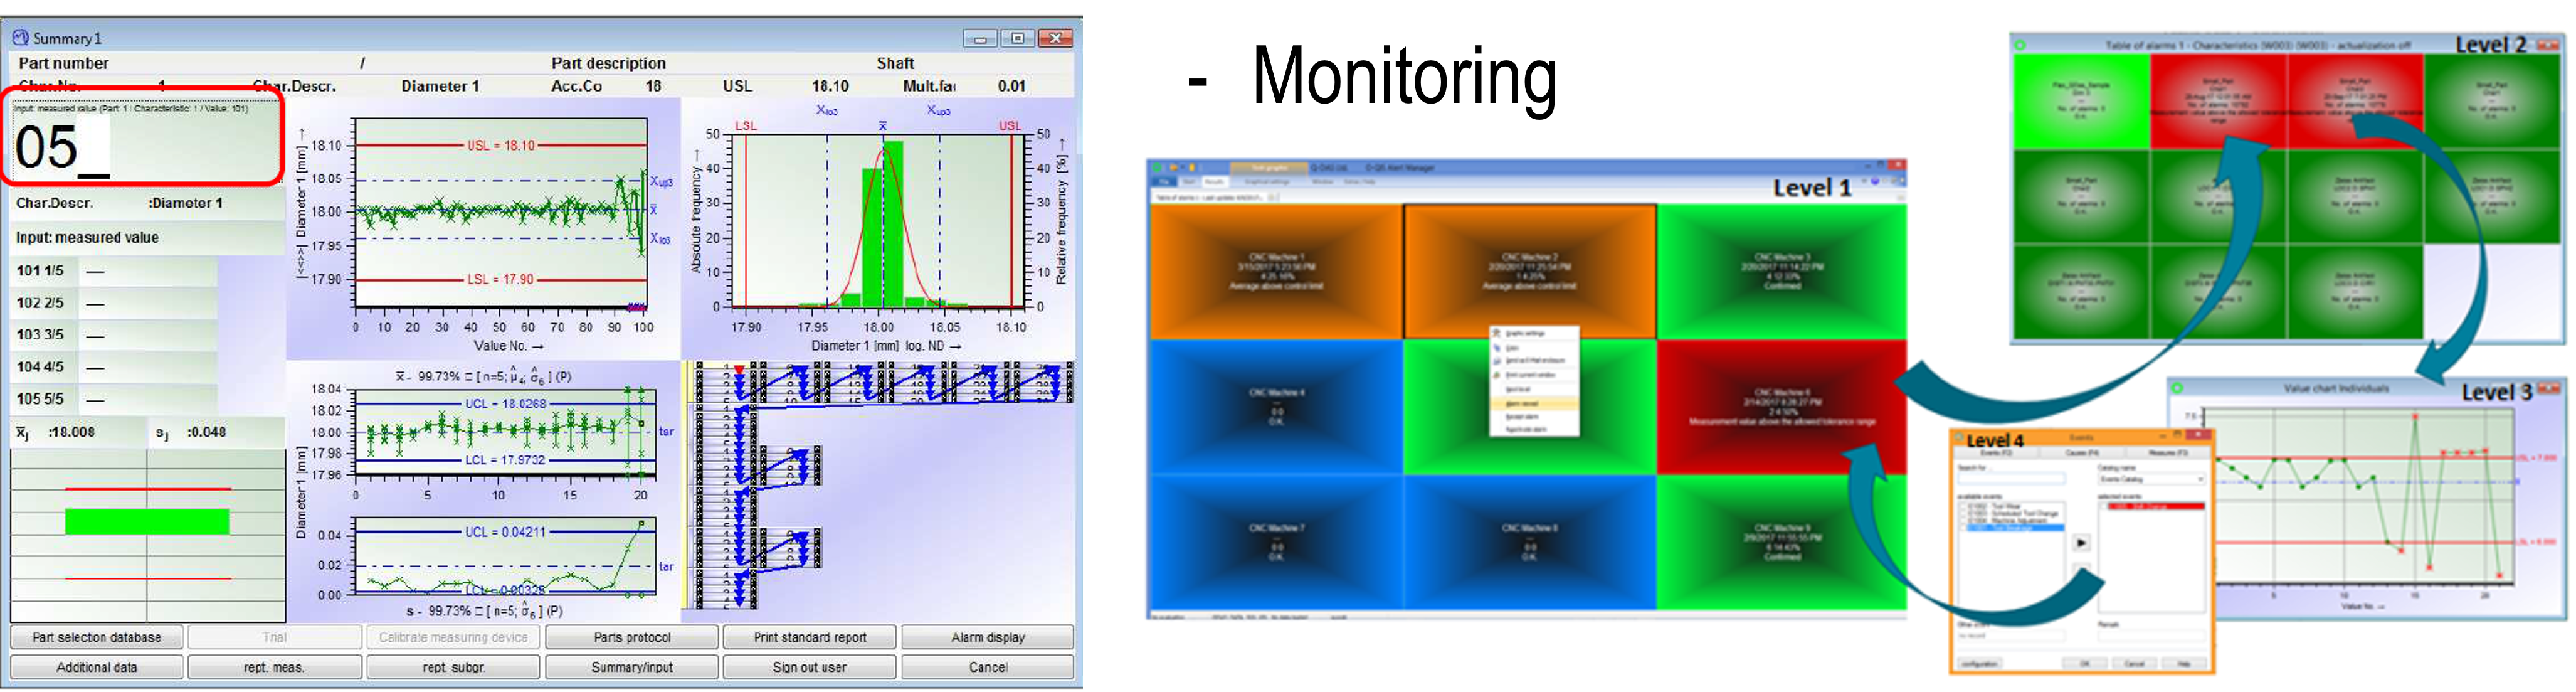
1) O-QIS
- Collects data from all the measuring instrument and Displays it in real time on the dashboard.
- Displays real-time production machine data on the shop floor to monitor machine performance and support root-cause-based issue resolution.
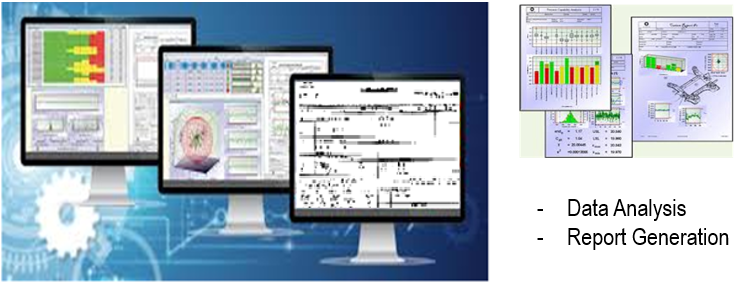
2) QS-STAT
- Once the data has been collected with O-QIS, you can use the QS-STAT for data analysis and reporting.
3)Q-DM
- Lastly, Q-DM acts as a central hub, collecting data from multiple measurement stations and managing it in a database. It also enables automation through seamless system integration.
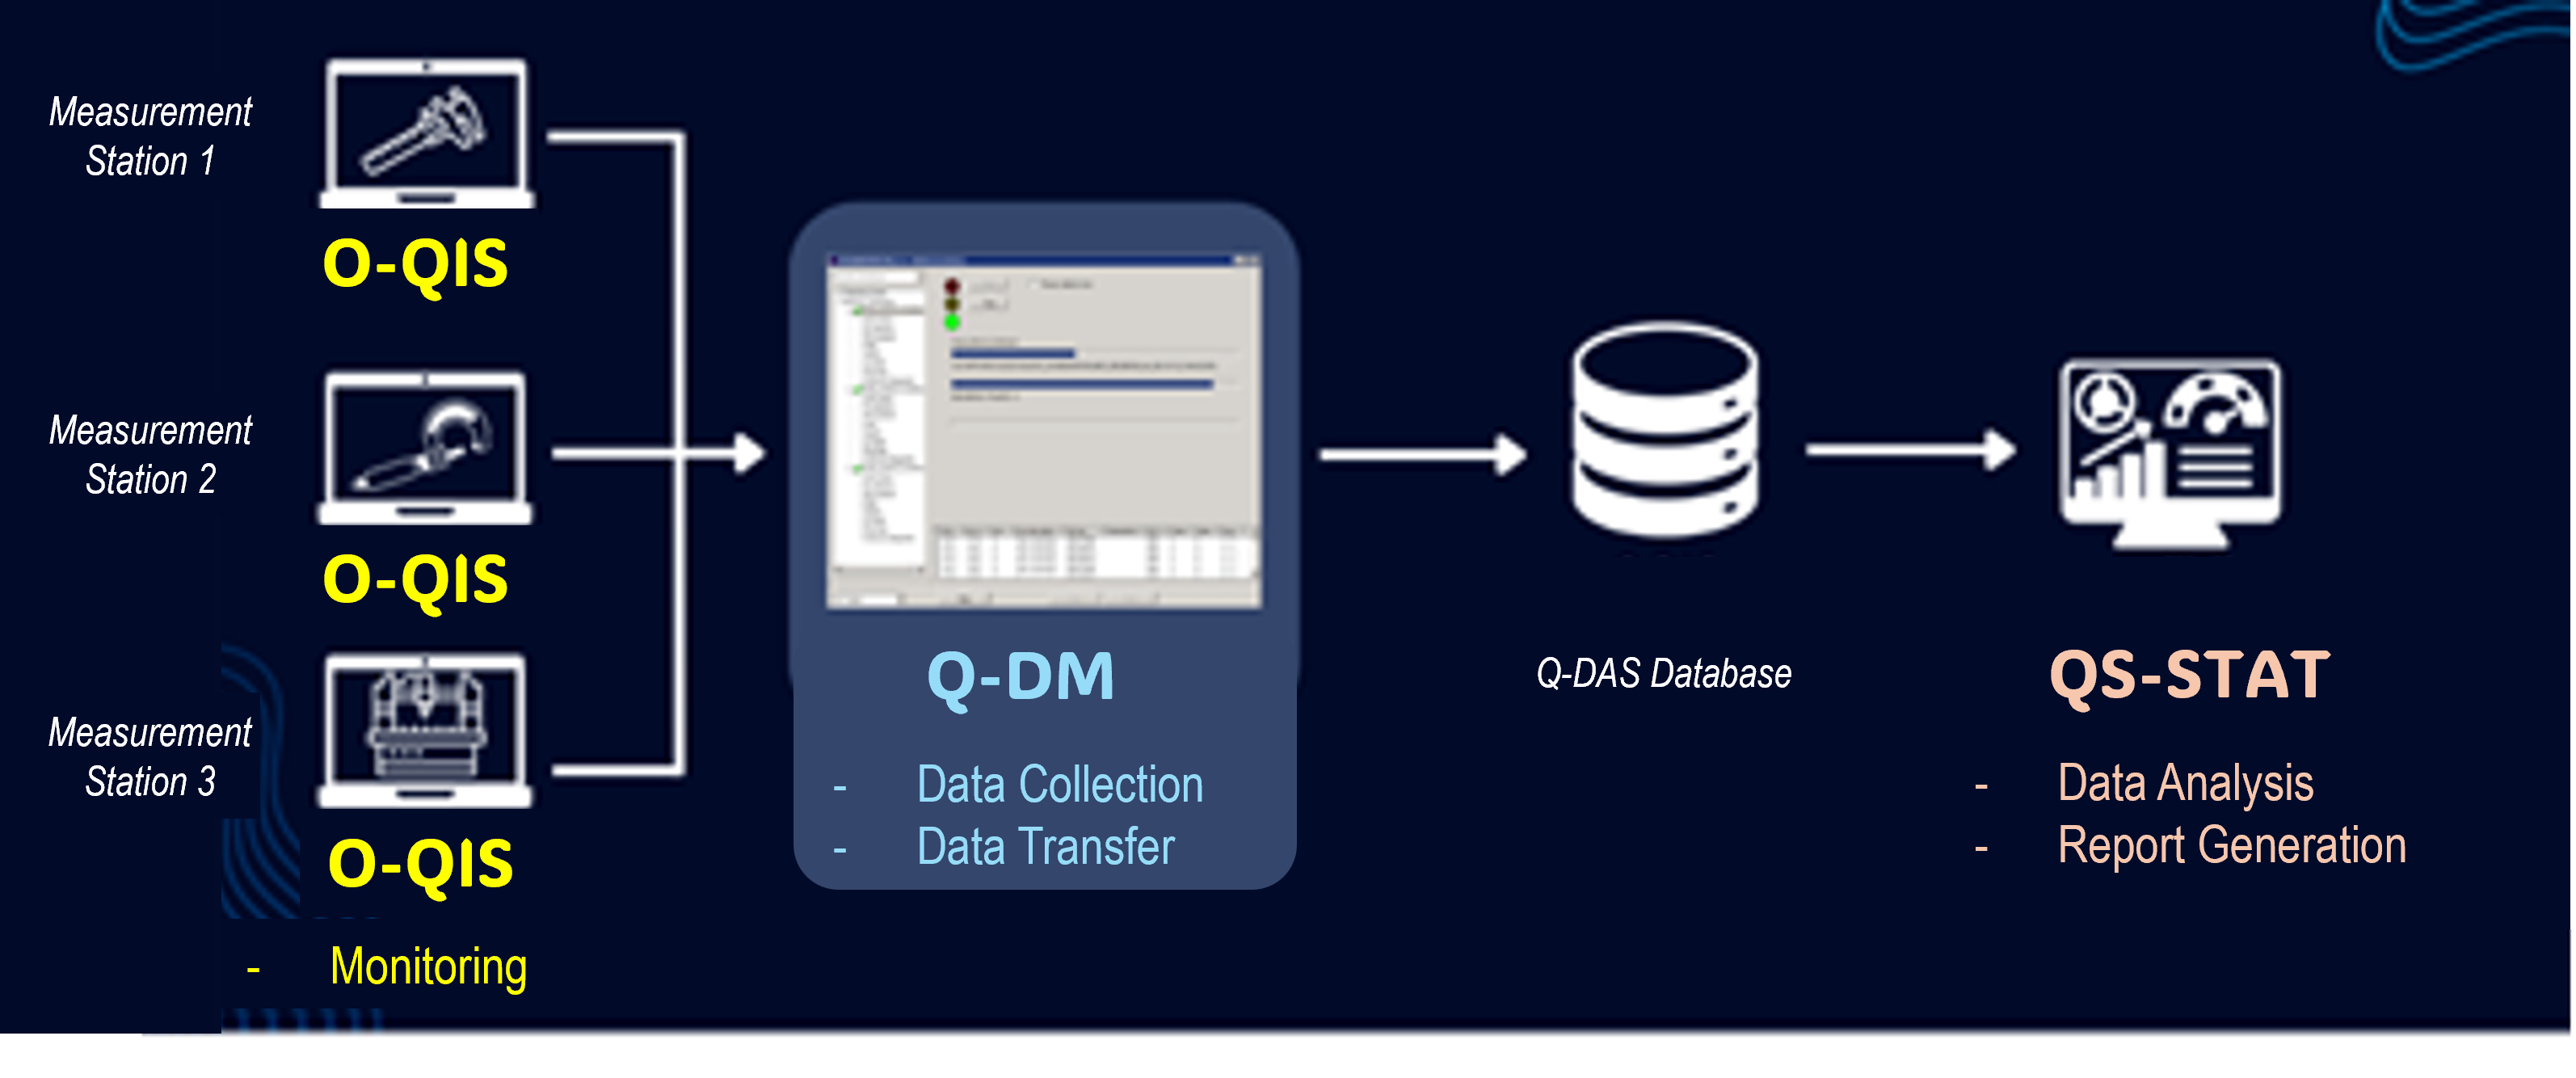
* Q-DM is required for customers who have multiple Measurement Stations.
What’s the best way to implement the various Q-DAS licenses in our company?
Some customers actually start with 1) O-QIS, then add 2) Q-DM, and eventually use 3) QS-STAT, but some choose to adopt all three together right from the start, depending on the number of the measurement satations and purposes.
We’ll show you a few examples to give you a better idea.
| Case 1 | Case 2 | Case 3 | Case 4 | |
| Necessary Licenses | O-QIS *1 | O-QIS *1 + QS-STAT *1 | O-QIS *2 + Q-DM *2 | O-QIS *2 + QS-STAT *1 + Q-DM *1 |
| # of measurement station | 1 (Single) | 1 (Single) | 2 (Multiple) | 2 (Multiple) |
| Main Purpose | Real-Time data monitoring | Real-Time data monitoring + Statistical analysis | Real-Time data monitoring with Centralized data management | Real-Time data monitoring + Statistical analysis with Centralized data management |
| Key Benefit 1: Provides real-time monitoring for quick, on-site quality decisions. | ✓ | ✓ | ✓ | ✓ |
| Key Benefit 2: Adds statistical analysis to support long-term process improvement. | × | ✓ | × | ✓ |
| Key Benefit 3: Centralizes and automates data collection from multiple stations. | × | × | ✓ | ✓ |
As you’ve seen, “Case 4” delivers full visibility, analytics, and data control for quality management.
I understand it!
I will discuss with our QA/QC team what we currently need and how we plan to expand in the future.